NikePlus Running Map
2014.07.29
Inspired by Garrett Miller's (relatively) recent blog post, Mapping Moves, I decided to do something else with all my NikePlus data and create a map of my runs. Unfortunately for me, the Nike data is more difficult to liberate than from other sources. Fortunately for me, and anyone else trying to do this, there are some pre-existing tools to solve this issue.
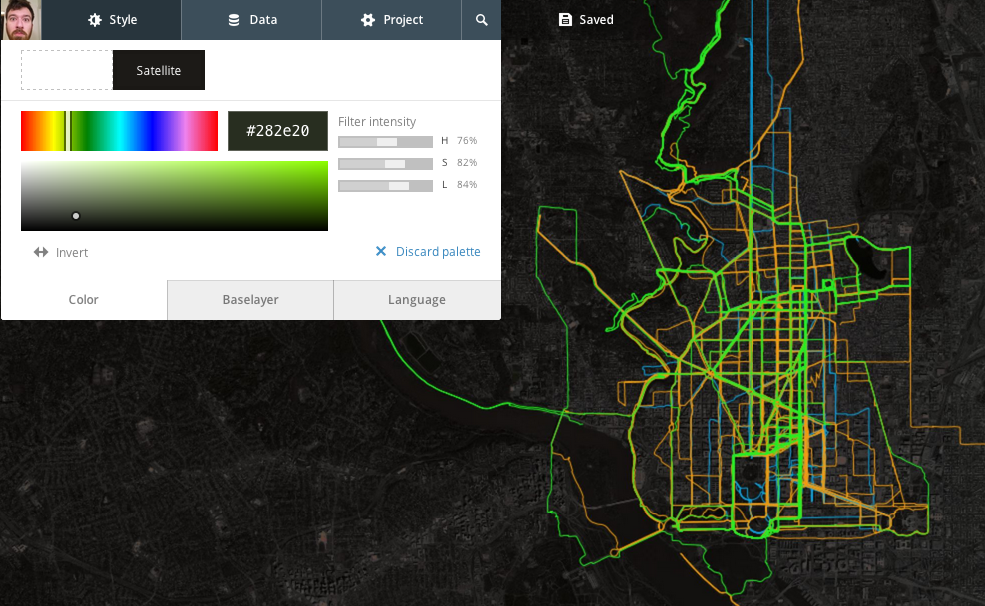
2012 in blue, 2013 in orange, 2014 in green. View fullscreen
Before starting
Get these things:
The data
First, I used Matt Stuehler's
site (again) to export all of
my runs as .gpx files. If you have trouble exporting them all at the
same time, it helps to break them up into 30-40 run groups.
The easiest way to import this data into TileMill is going to be as a
.geojson file but it will help if we have our data a little more
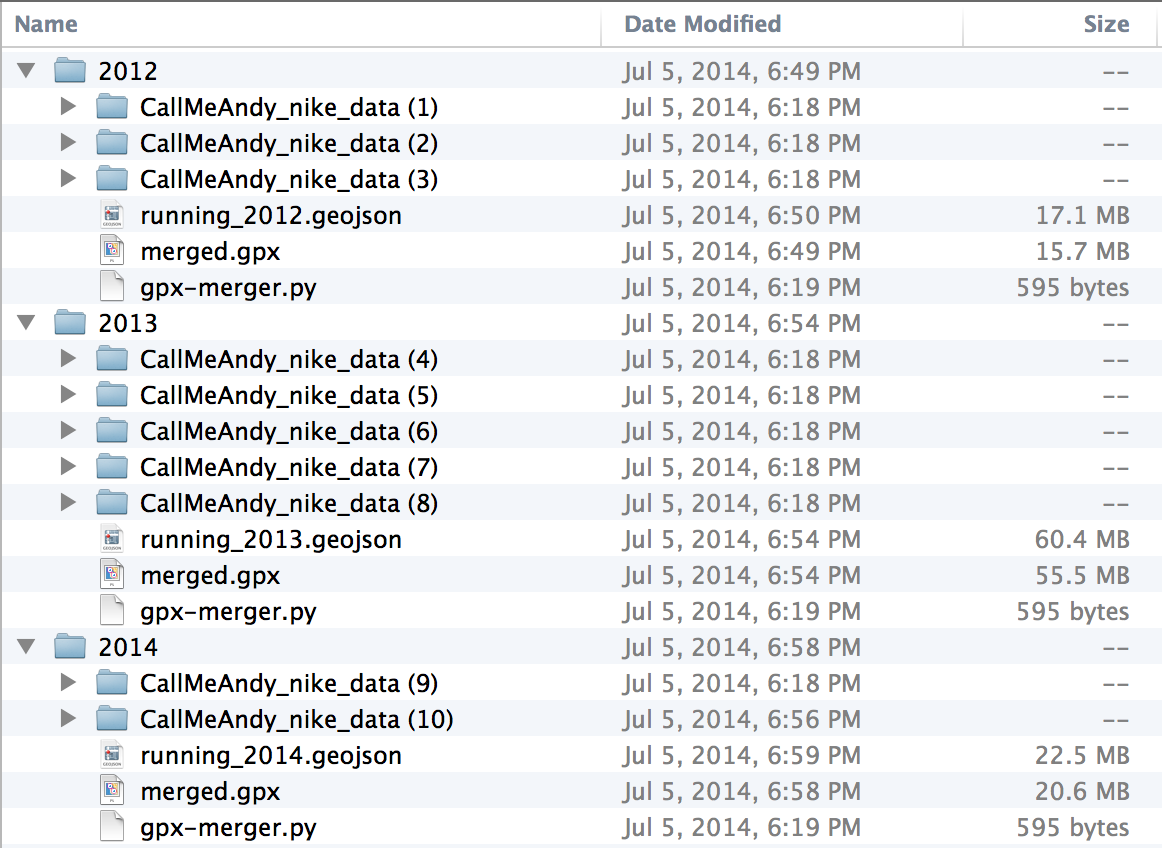
organized before converting. I had three years of data so I decided that
I would eventually want to style it by year. Here's the folder structure
I used:

The Python file in each folder is a slight modification of one used for OpenStreetMap exports. I'm going to post it here because I don't like having to clone a GitHub repo just to grab one file.:
from bs4 import BeautifulSoup
import glob
import time

output_file_name = "merged.gpx"

fo = open(output_file_name, "w")
fo.write('<?xml version="1.0" encoding="UTF-8"?>')
fo.write('<gpx version="1.0">')

gpx_list = glob.glob('*/*.gpx')

for gpx_file_name in gpx_list:
    print "Parsing "+gpx_file_name+" ..."

    fi = open(gpx_file_name,"r")
    gpx_trace = fi.read()
    fi.close()

    soup = BeautifulSoup(gpx_trace)
    fo.write(soup.trk.prettify())

    time.sleep(1)

fo.write('</gpx>')
fo.close()
Copy this, save it as gpx-merger.py, and put one in each folder
structure like I did above (it needs to be one folder "below" the data
it is aggregating). To run it, navigate to that folder in the command
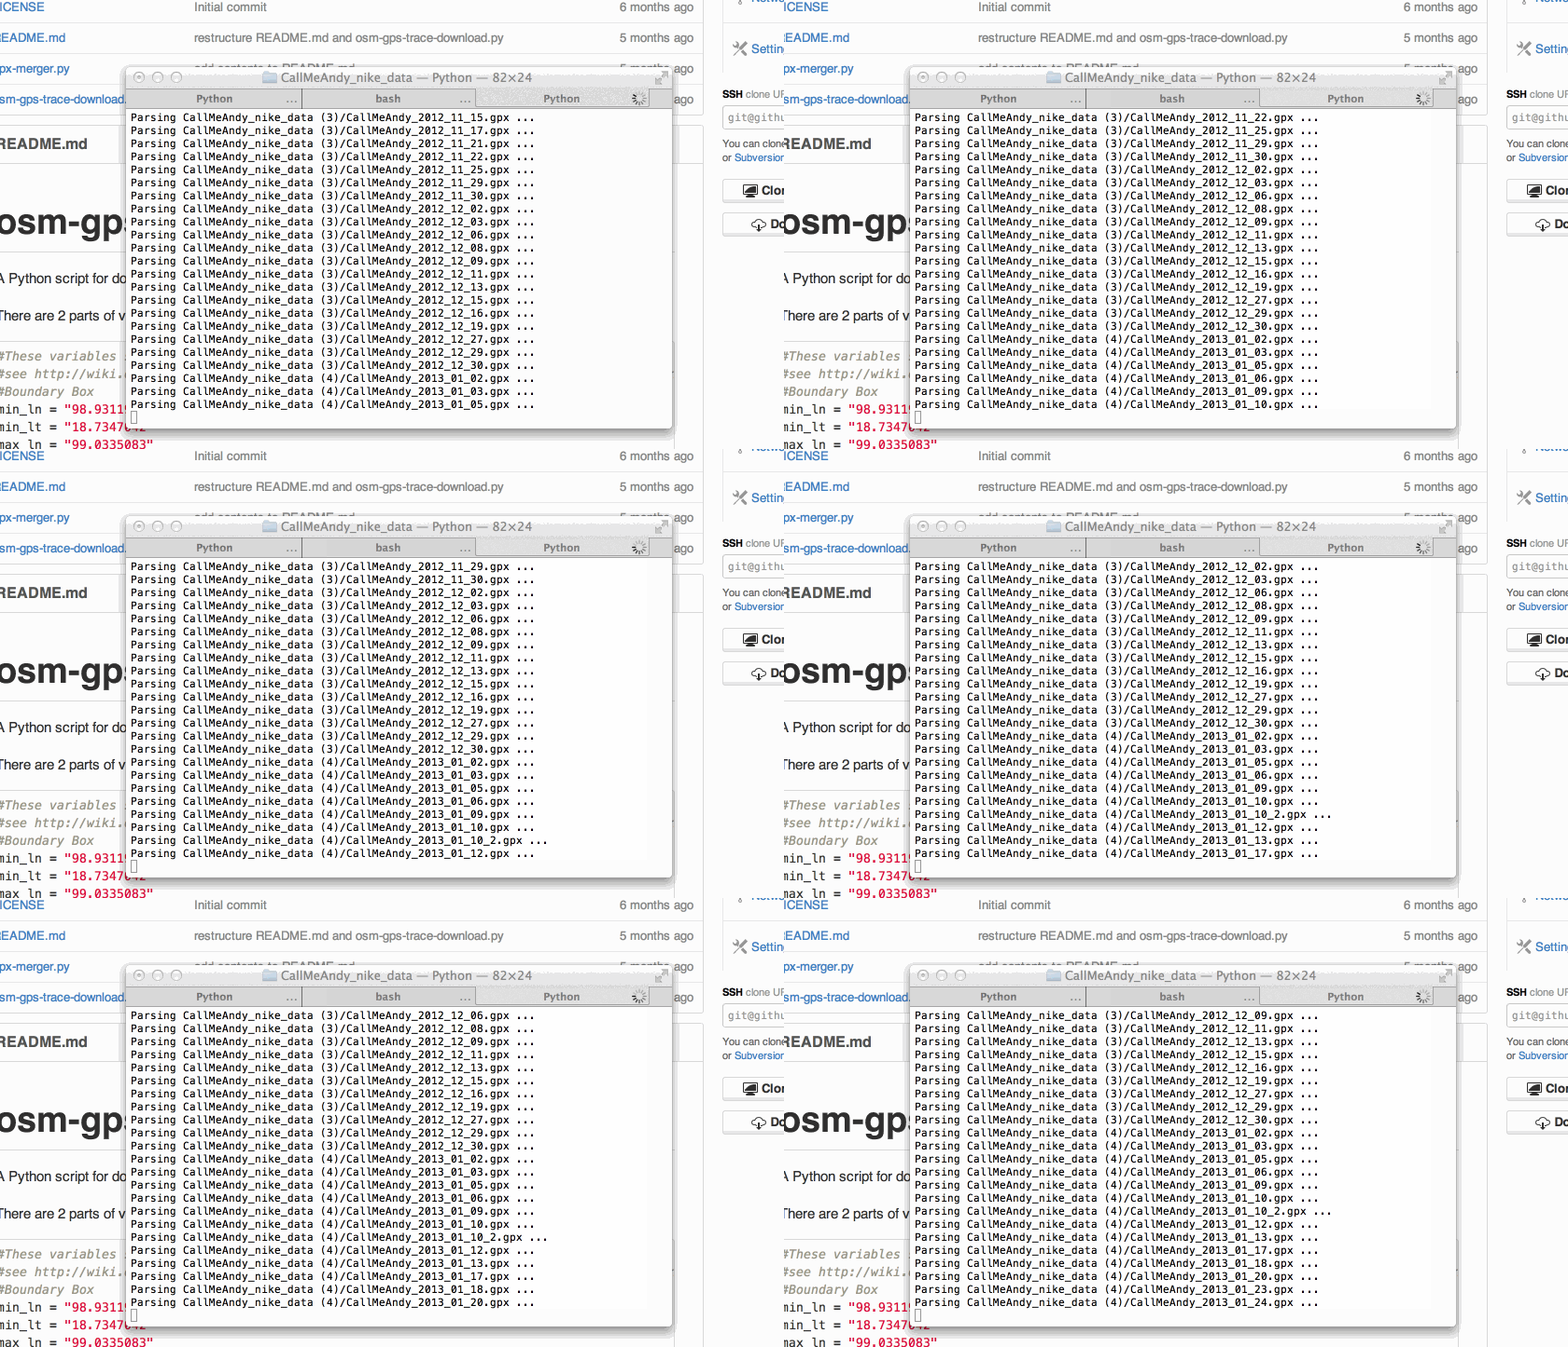
line/terminal and type python gpx-merger.py. Sit back and wait.

Each time you run it in a new place, it will output a file called
merged.gpx. Now you can pretty much follow the rest of Garrett's blog
post:
- Use
togeojsonto convert each merged file into a.geojsonfile - Start a new TileMill project and import each file as a separate layer
- Style, then upload to MapBox
Styling tips
- Bright colors look awesome.
- Set the
line-opacityattribute to ~0.25. This means that it will take four times over the same path to make the line fully opaque and gives a better idea of how often you run in certain areas. - Use the satellite imagery (requires a basic MapBox account) with a near-black color and saturated filter settings (>75%).
