Cloud.gov Pages
Cloud.gov Pages helps federal government entities publish compliant static websites quickly and seamlessly. Cloud.gov Pages integrates with GitHub and is built on top of Cloud.gov, which uses Amazon Web Services.
Software Engineer
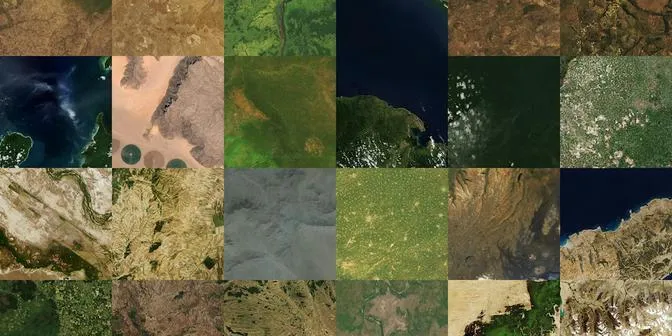
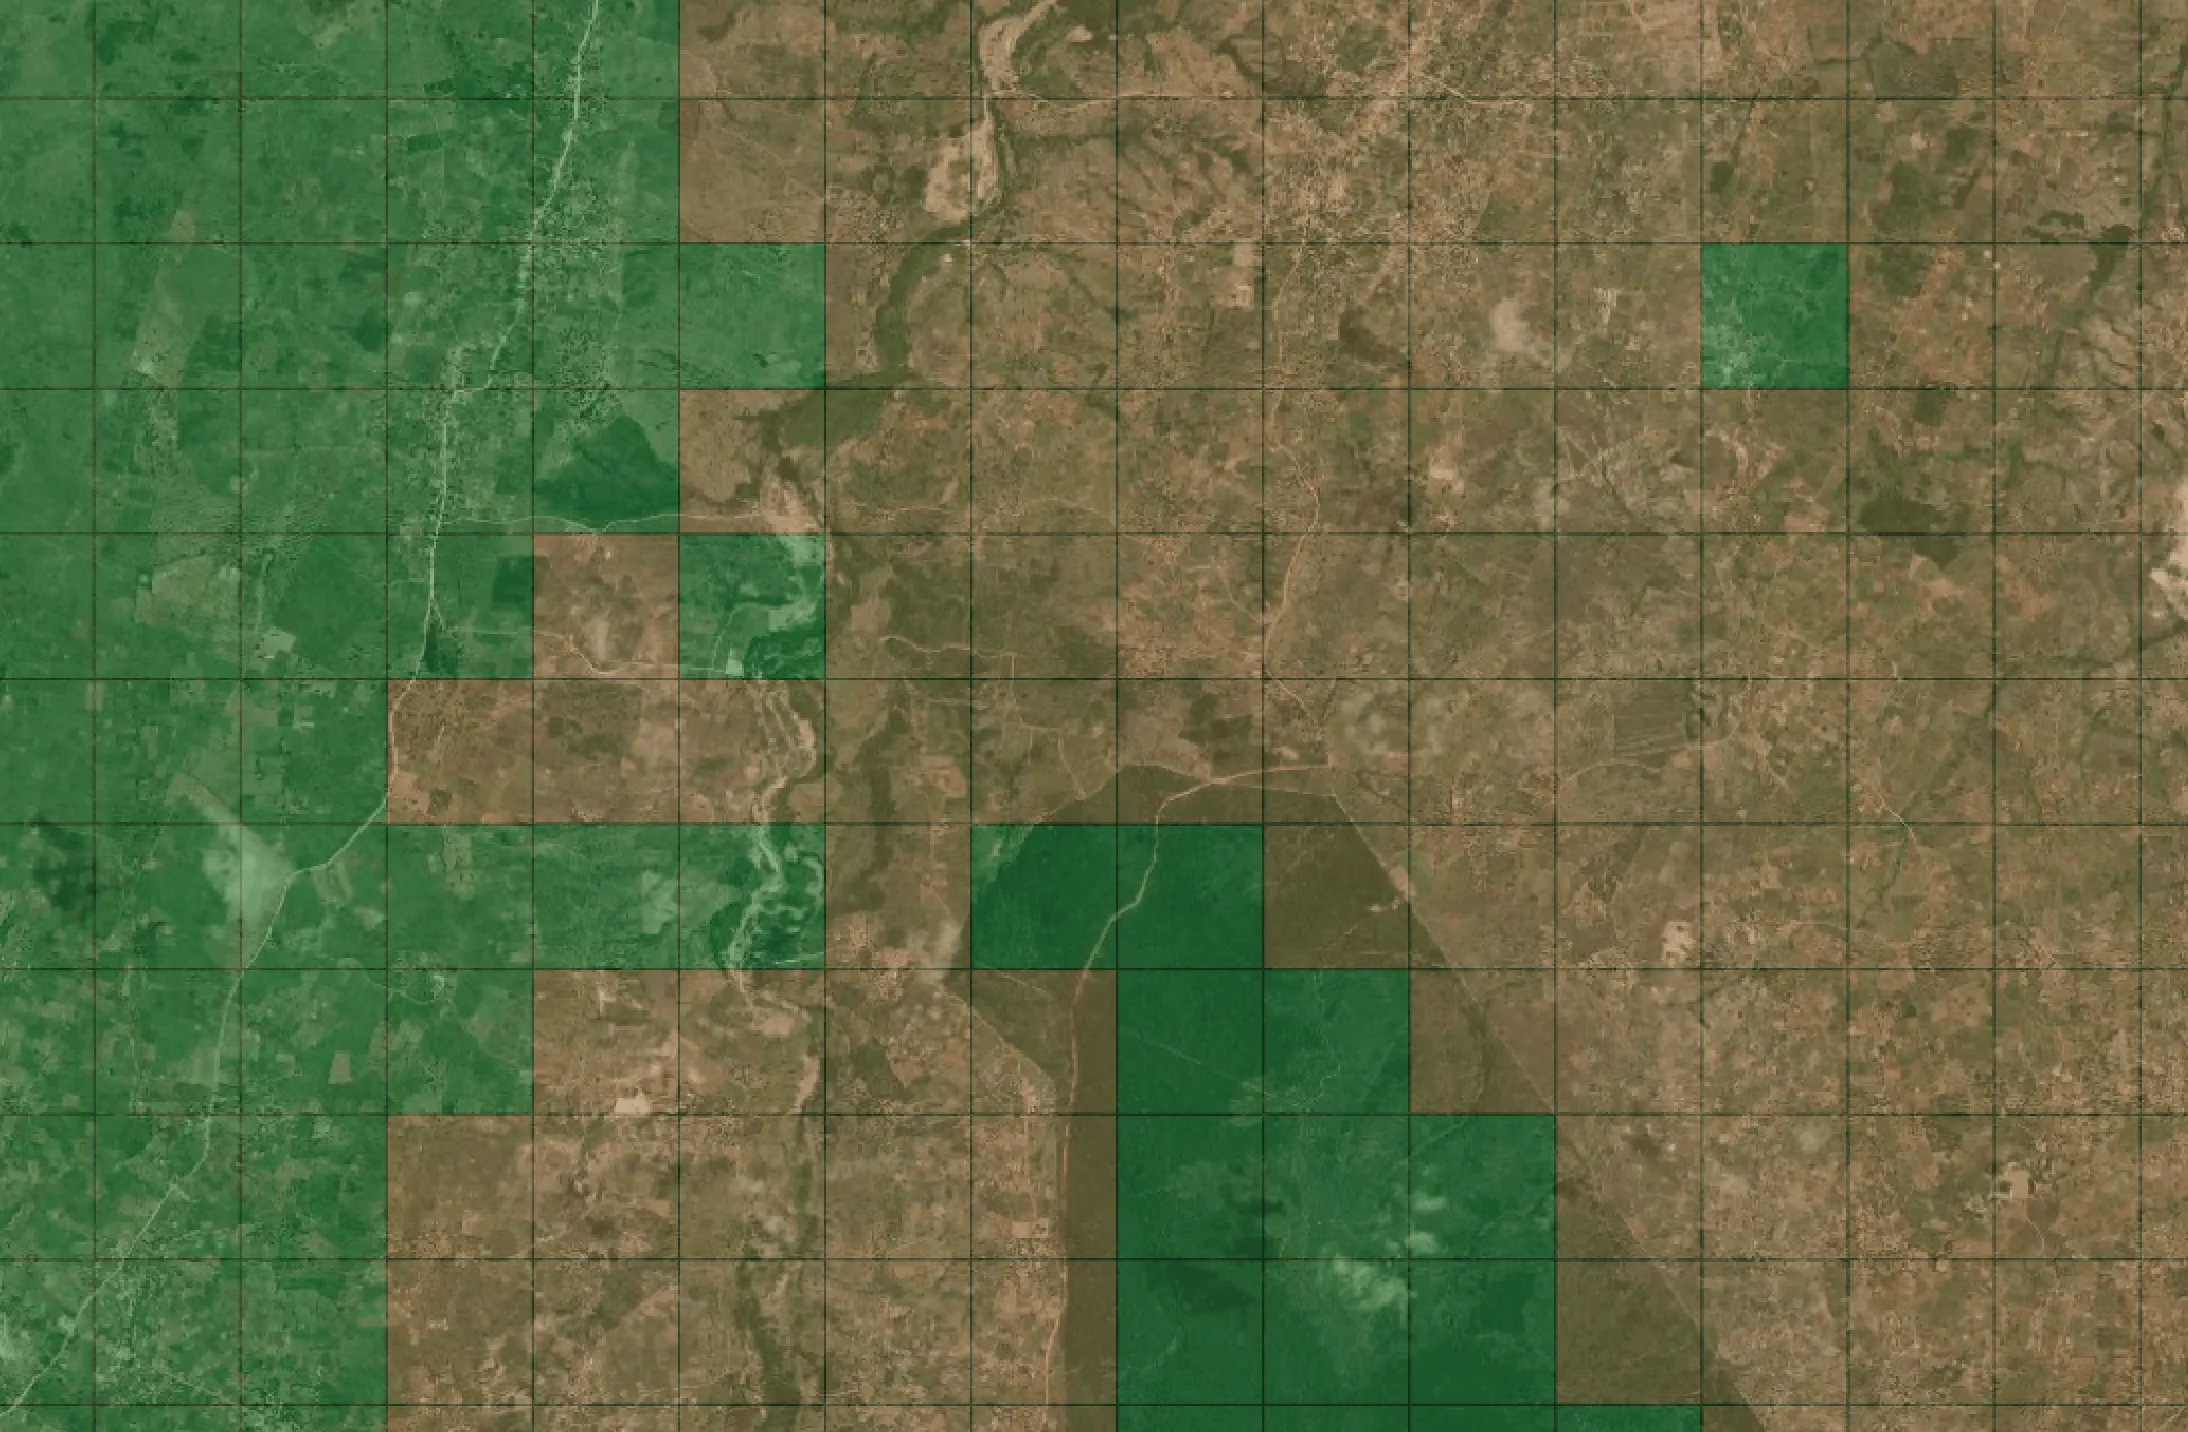
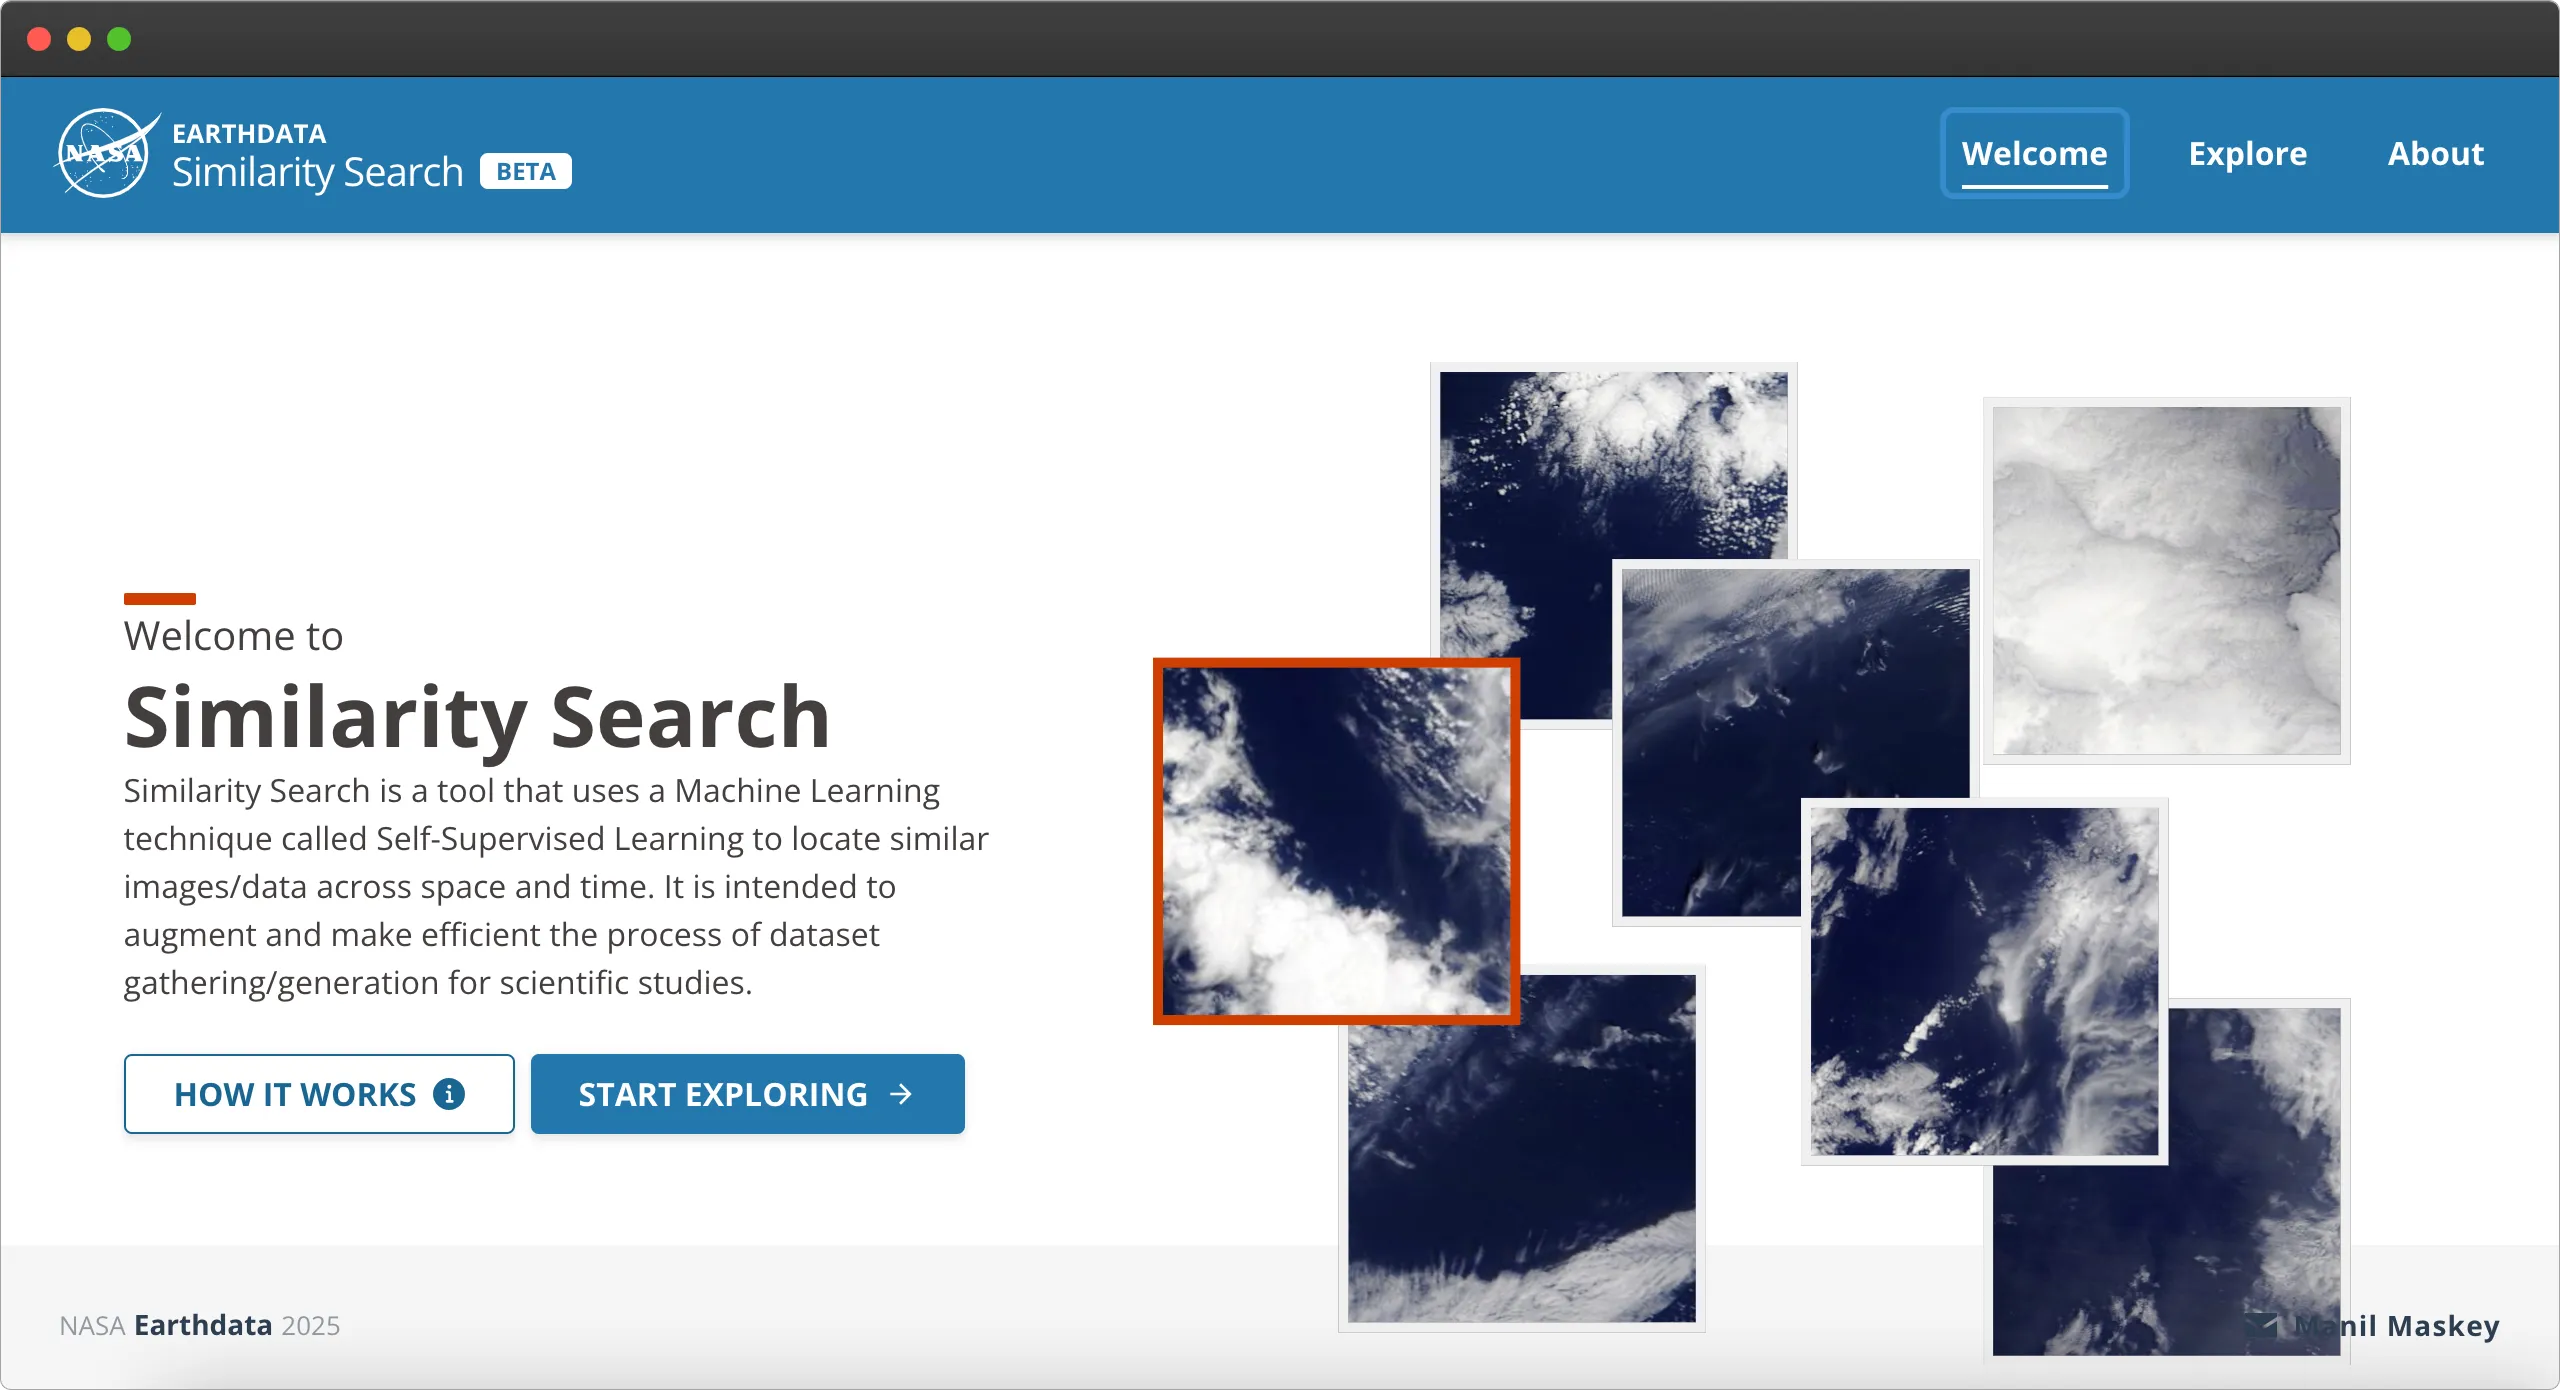
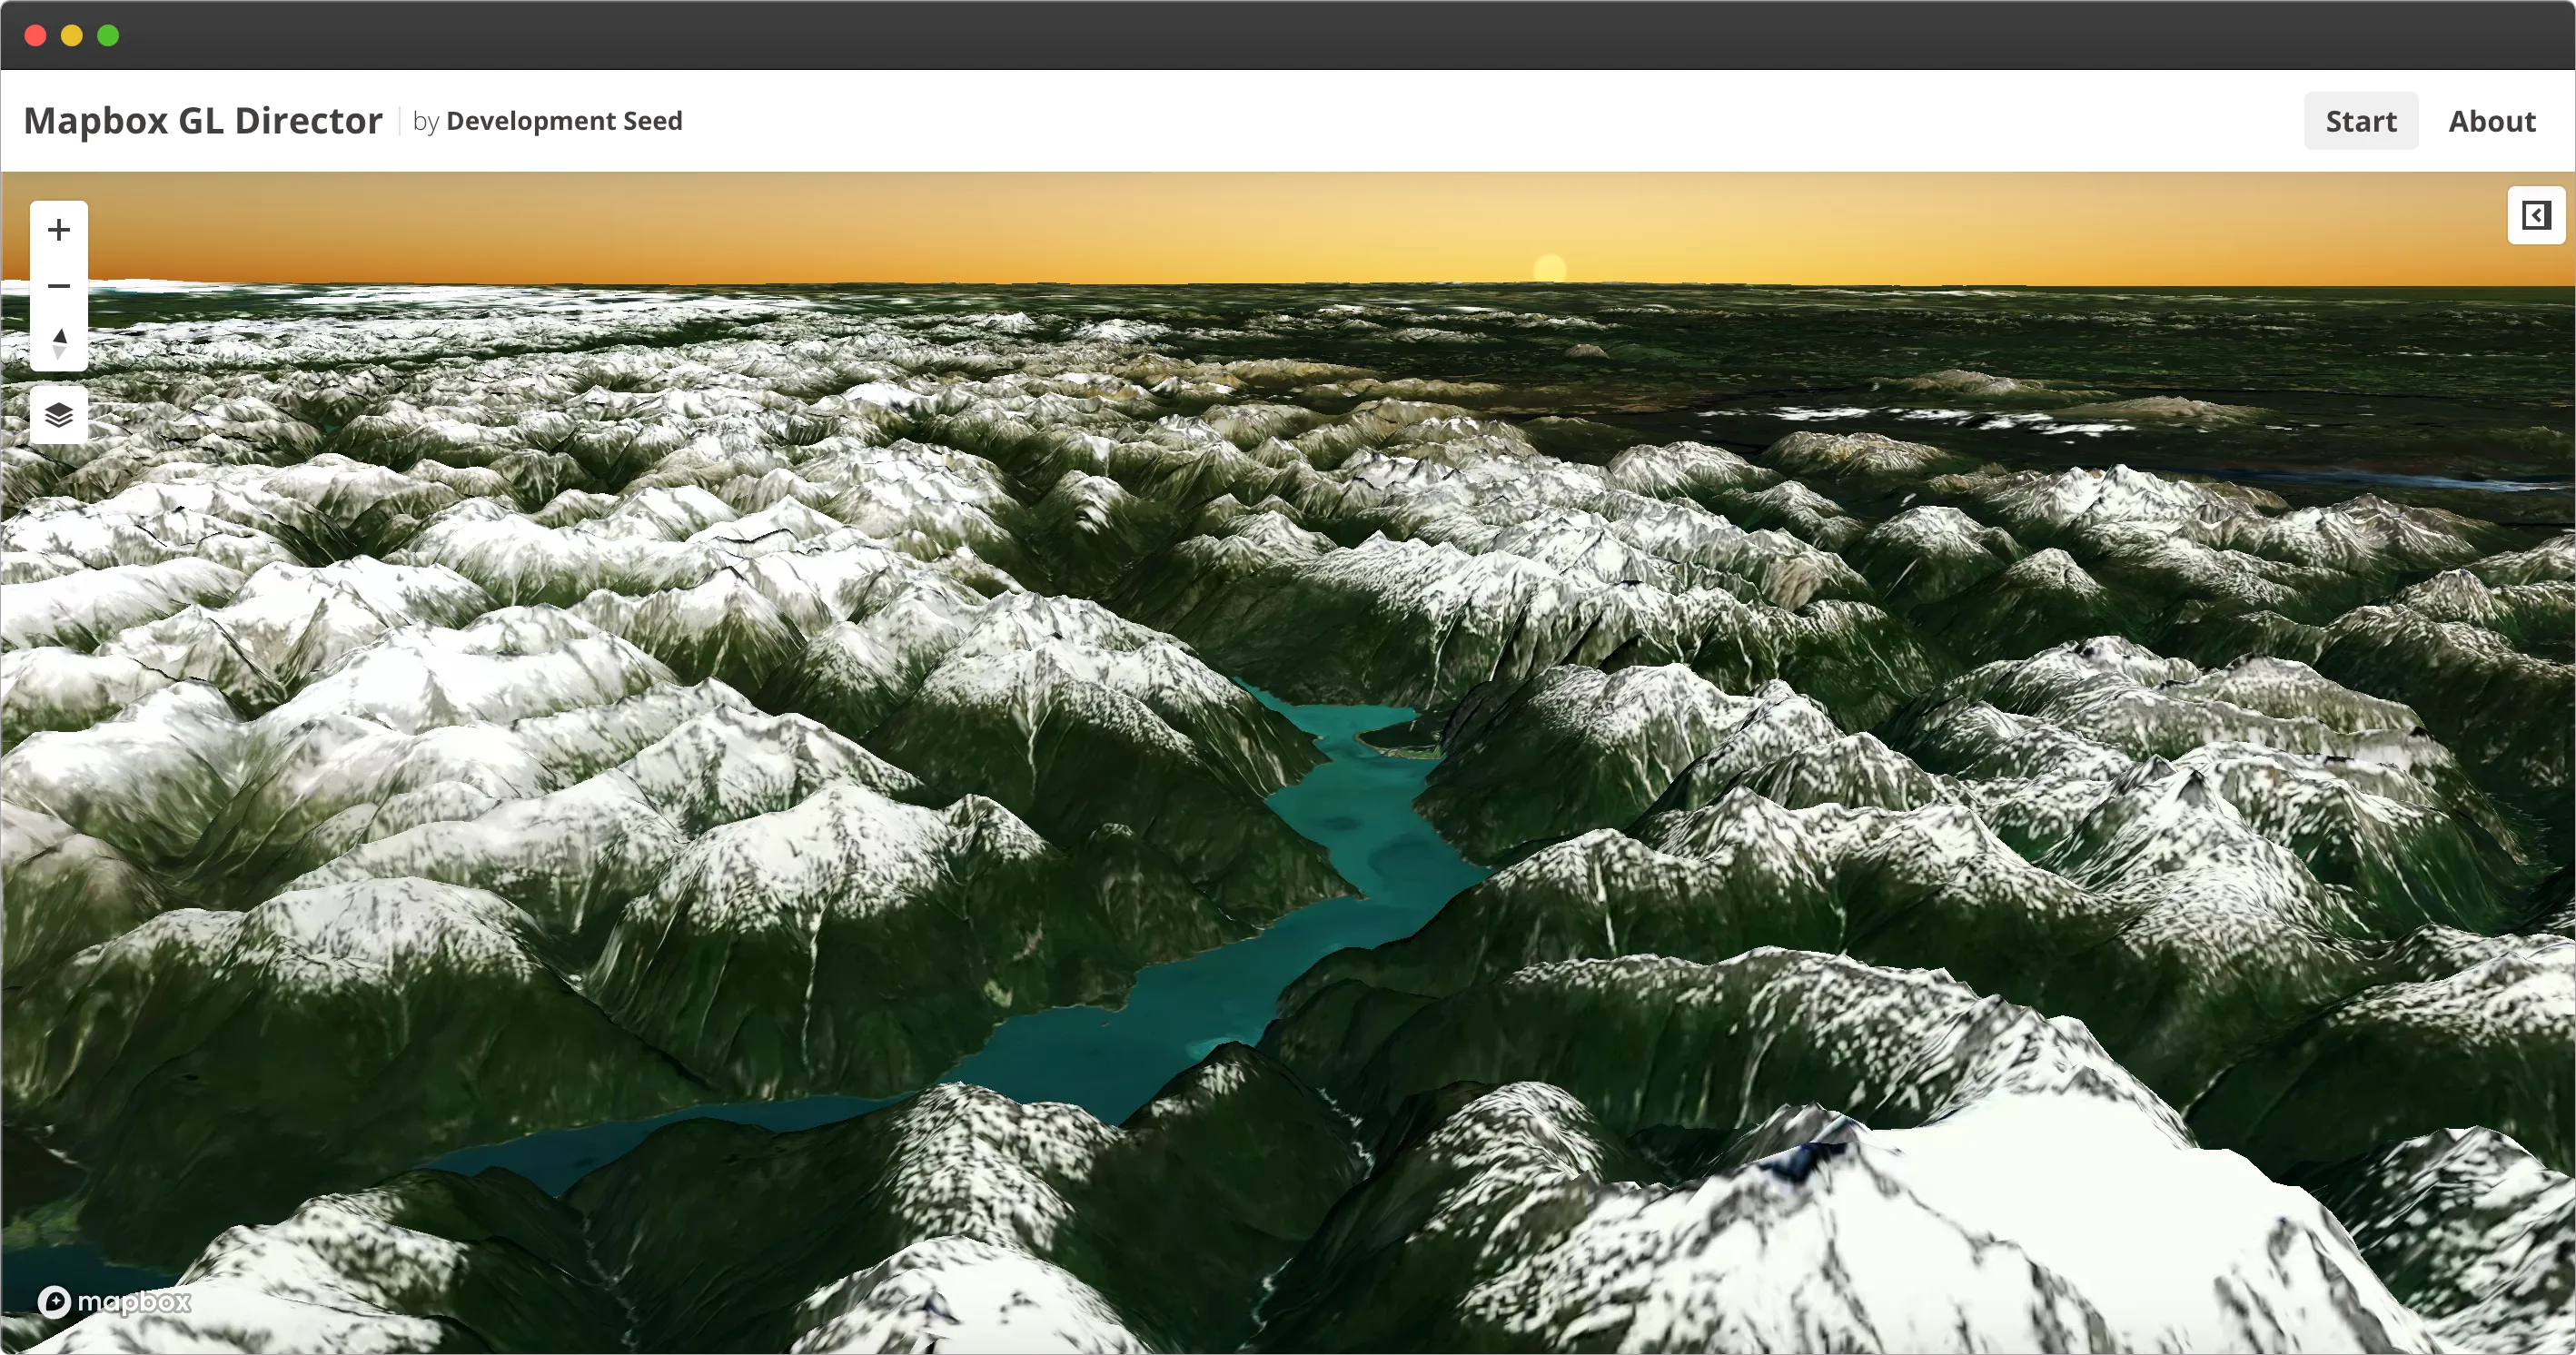
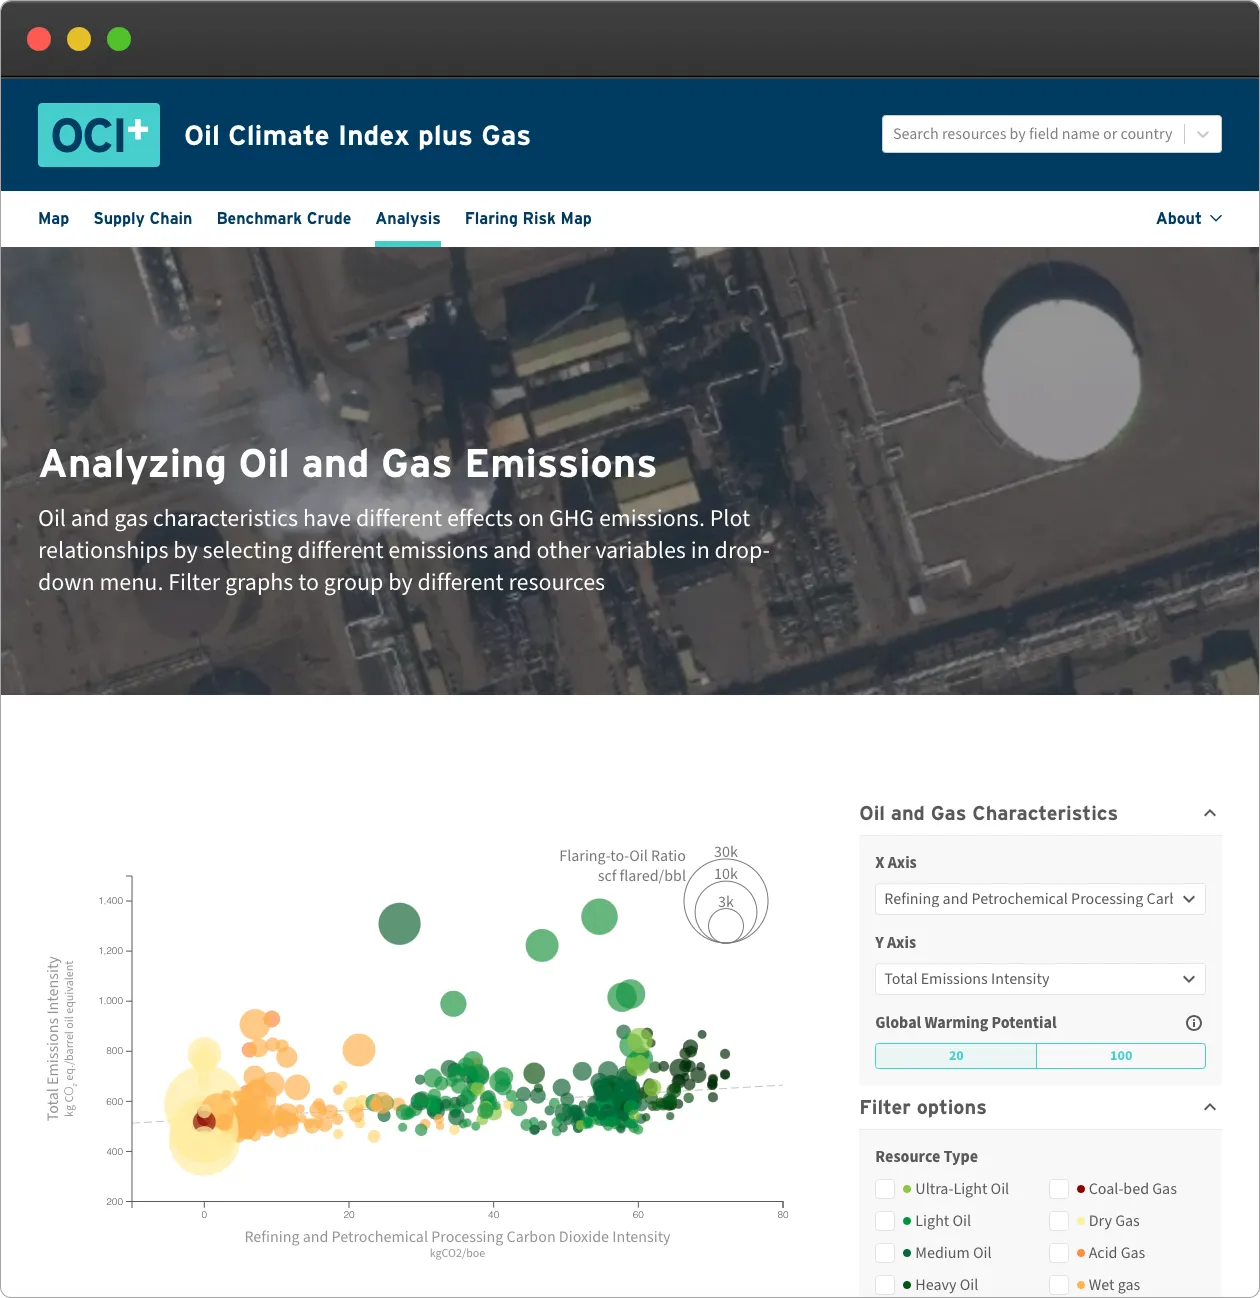
Hi, I'm Drew! I've worked in software development for over ten years. I've primarily focused on backend tasks like cloud architecture, API development, and data processing. I'm also happy to write frontend code, React or otherwise, especially for data visualizations. I've worked on many machine learning and data analysis projects, particularly those involving satellite imagery.
I'm a strong communicator and I've given multiple conference talks. I enjoy mentoring early-career engineers and participating in setting engineering standards across an organization.
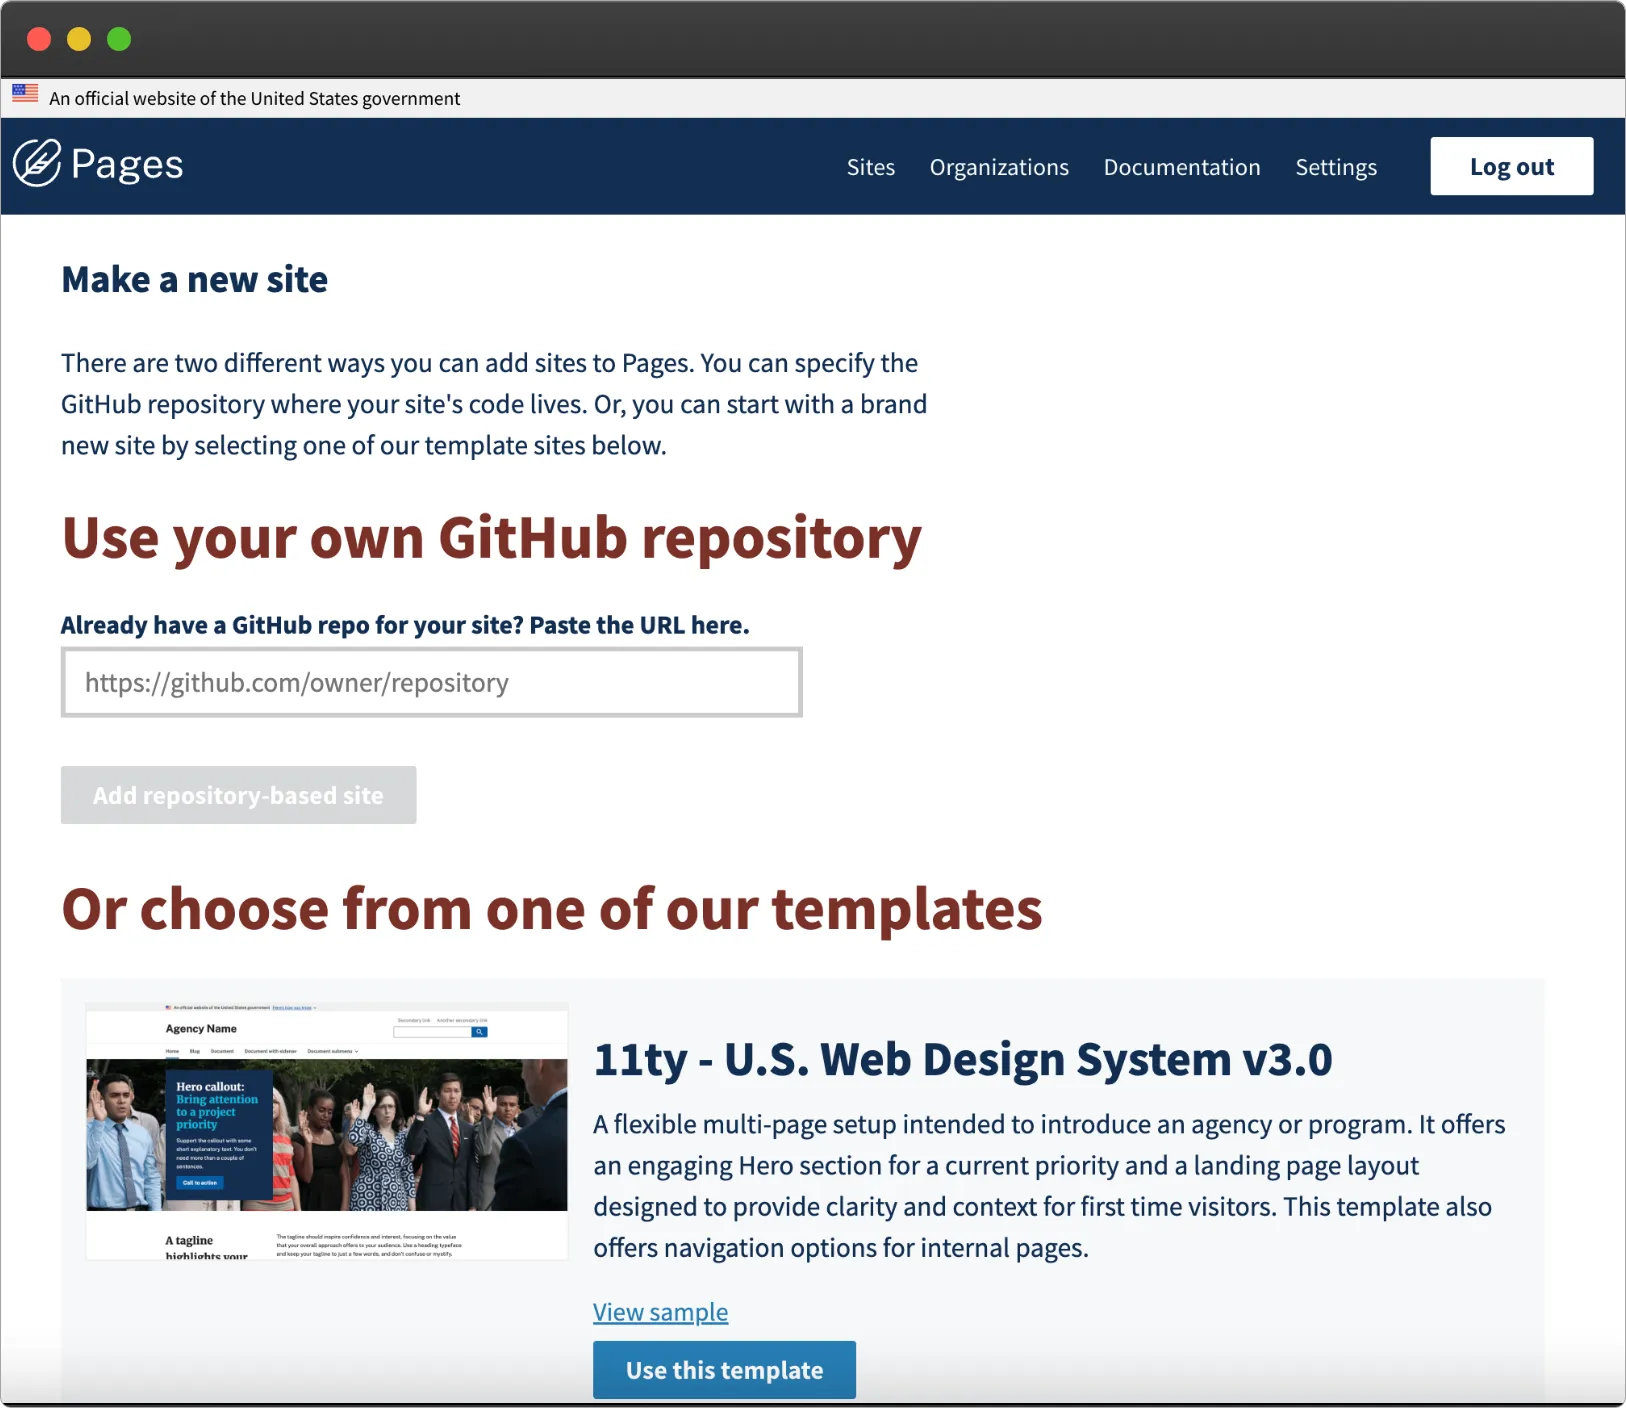
I current work at Cloud.gov. I previously worked at Development Seed and Capital One.
Cloud.gov Pages helps federal government entities publish compliant static websites quickly and seamlessly. Cloud.gov Pages integrates with GitHub and is built on top of Cloud.gov, which uses Amazon Web Services.
I've created a number of AWS architecture patterns for running machine learning models over satellite imagery at scale. The linked repository demonstrates using AWS Lambda to parallize imagery downloads and run inference via TensorFlow Serving running on an ECS-managed GPU cluster.
Label Maker is a Python library which helps prepare machine learning training data from satellite imagery sources and OpenStreetMap data.
This tool's backend uses Faiss in conjunction with PostgreSQL for efficient similarity search over vectors derived from NASA MODIS imagery.
This was an experimental interface to generate terrain flyovers for embedding in apps and websites. It was built using the new Mapbox GL JS SDK + Camera API.
The OCI⁺ quantifies and compares greenhouse gas emissions intensities from global oil and gas assets. It uses a variety of data visualization techniques to illustrate how certain variables can have a variable impact on emissions.