Benford's Law
2014.04.21
The last thing the internet needs is one more demonstration of Benford's Law but I'm going to do it anyway for three reasons:
- it's a good way to experiment with the formatting of the site [1]
- it's a fairly simple concept that is still a little non-intuitive
- it's a good demonstration of how more local governments are making their financial data publicly available
Tons of credit for this idea goes to my old college friend, Aaron, who did a very similar analysis over on his website.
A Short Explanation
From Wikipedia:
Benford's Law, also called the First-Digit Law, refers to the frequency distribution of digits in many (but not all) real-life sources of data. In this distribution, the number 1 occurs as the leading digit about 30% of the time, while larger numbers occur in that position less frequently: 9 as the first digit less than 5% of the time.
This result has been found to apply to a wide variety of data sets, including electricity bills, street addresses, stock prices, population numbers, death rates, lengths of rivers, physical and mathematical constants, and processes described by power laws (which are very common in nature). It tends to be most accurate when values are distributed across multiple orders of magnitude.
I'd recommend reading the whole article as it also does a good job of explaining a few different ways to understand how this distribution arises. Specifically, this is the expected distribution of first digits:
| First Digit | Frequency |
|---|---|
| 1 | 30.1% |
| 2 | 17.6% |
| 3 | 12.5% |
| 4 | 9.7% |
| 5 | 7.9% |
| 6 | 6.7% |
| 7 | 5.8% |
| 8 | 5.1% |
| 9 | 4.6% |
Now let's look for some data to test this on.
The Springfield Massachusetts Open Checkbook
For my "real-life source of data", I searched for open city checkbooks on Google because a large source of financial transaction data should demonstrate Benford's Law really well and I was secretly hoping to expose some fraud (more on this shortly). The easiest to download option on the front page was for Springfield, Massachusetts. I would have liked to use DC but I couldn't find their information publicly available.
What's cool about Benford's Law is that it can be used to identify fraudulent activity given large volumes of transaction data. Humans tend to make up numbers that are distributed uniformly which would very obviously not match the distribution seen above. But the conundrum, at least for trying to uncover fraud via the internet, is this: any city treasurer committing fraud probably isn't making the records publicly available and vice versa. So until I get subpoena power, this analysis will be a confirmation of the statistics rather than uncovering any devious activities.
The downloaded data has 41,279 transactions totaling $294.3MM as of April 21st, 2014 (Their fiscal year appears to begin in July). If you're interested in city expenditures, the data is pretty detailed but I was really only after the transactions amounts. After a little bit of data cleaning, I wrote a quick R script to pull out the first digit from all the transactions:
 benford <- function(transaction_vector){
     textv <- as.character(transaction_vector*100)
     digit_vector <- sapply(textv, substr, start = 1, stop = 1, USE.NAMES = FALSE)
     as.numeric(digit_vector)
 }
Comparing the frequency from our data to the expected distribution:
| First Digit | Expected | Actual |
|---|---|---|
| 1 | 30.1% | 29.8% |
| 2 | 17.6% | 18.3% |
| 3 | 12.5% | 10.8% |
| 4 | 9.7% | 8.5% |
| 5 | 7.9% | 7.9% |
| 6 | 6.7% | 7.3% |
| 7 | 5.8% | 6.3% |
| 8 | 5.1% | 5.2% |
| 9 | 4.6% | 5.9% |
Looks like a pretty close match, though if I we're actually auditing them, I'd want additional information to explain why 9 is so common as a first digit in their transaction list. [2]
Next let's try out the excellent tool Chartbuilder to plot the frequency of first digits against expected distribution from above:
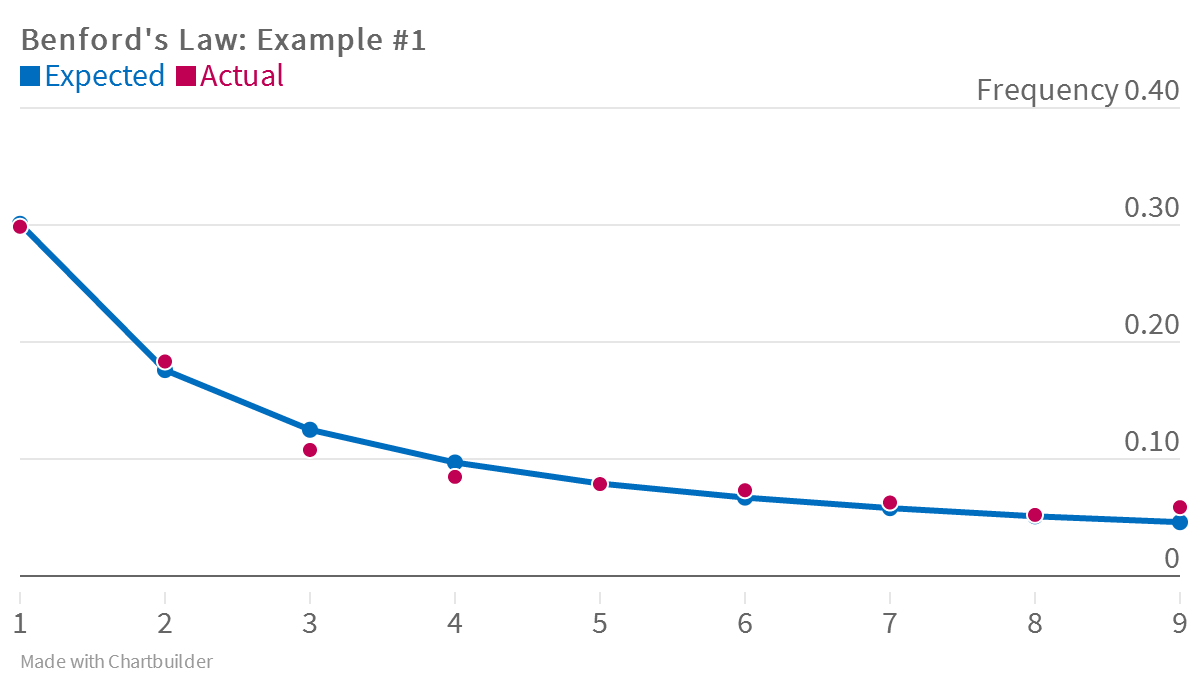
Cool. Chartbuilder isn't meant to be a super powerful plotting tool but it does make it easy to create great looking charts really quickly, hence its use in a lot of digital newsrooms (NPR, WSJ, 538, etc.).
Scale Invariance
I wanted to extend the demonstration just slightly to show an additional feature of the distribution: it should be scale invariant so we can multiply our whole transaction list by any number and the law should still hold (this also means that Benford's Law will hold even if you measure your target variable in another scale; think switching from dollars to euro or feet to meters).
Let's run through an example first and then I'll reveal the visualization. Using the case where the constant is 2, think about what happens to all of our original numbers: things that start with 1 (30.1%) will now start with 2 or 3, things that start with 2 become 4 or 5, and so on. We look to the expected distributions above and see that numbers starting with 5 through 9 should make up (7.9% + 6.7% + 5.8% + 5.1% + 4.6%) = 30.1% of the first digits and these are all the numbers which when multiplied by 2, will now have a first digit of 1. The distribution, at least for ones, matches between the two groups!
Visualization
I refit a very cool visualization technique called Parallel Sets from Jason Davies using the D3.js library. Let's take a look first then I'll explain below:
Sorry if it's a lot to handle. Things to notice:
- Each color/shade represents a different "first digit group" from our original transaction list. You can hover over to see the value if you get lost.
- Each black bar with a number above it represents the associated first digit frequency for that transformation -- from original at the top to "multiplied by nine" at the bottom. You can hover over the bar/digit to see what portion of the total it represents. Notice that the lengths of these bars are remarkably consistent across the transformations (which is the point of this exercise).
- Each colored path shows how transaction amounts from the original list move to different "first digit groups" when multiplied by the different constants: In the first row, the 1's go to 2's and 3's, the 2's go to 4's and 5's and so on (as mentioned in the example before).
- All of the rows can be sorted by "numeric" and "size": there is at least one use to this (let me know if you find more) but it is more a relic of the original visualization. The one thing I would recommend is sorting the first row by reverse numeric ("<< numeric") and you can really clearly see how the 5's-9's from the original group end up as 1's when multiplied by 2 (and in the same proportion).
- The data is a little jumbled towards the end, that's just an artifact of a bad sorting attempt by me. Sorry.
So, that's Benford's Law and my first real post, hope you enjoyed it!